Here we are explaining the simple example.
Html Code
<html>
<head>
<script type="text/javascript" src="https://www.gstatic.com/charts/loader.js"></script>
<script type="text/javascript">
google.charts.load('current', {'packages':['bar']});
google.charts.setOnLoadCallback(drawChart);
function drawChart() {
var data = google.visualization.arrayToDataTable([
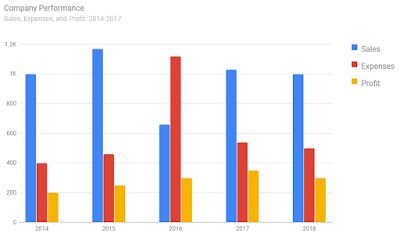
['Year', 'Sales', 'Expenses', 'Profit'],
['2014', 1000, 400, 200],
['2015', 1170, 460, 250],
['2016', 660, 1120, 300],
]);
var options = {
chart: {
title: 'Company Performance',
subtitle: 'Sales, Expenses, and Profit: 2014-2017',
},
isStacked:true,
colors:['orange'],
};
var chart = new google.charts.Bar(document.getElementById('columnchart_material'));
chart.draw(data, google.charts.Bar.convertOptions(options));
}
</script>
</head>
<body>
<div id="columnchart_material" style="width: 800px; height: 500px;"></div>
</body>
</html>
Result