Showing posts with label phpjavascript. Show all posts

Download file with speed limit using PHP

Here we are explaining about how to limit speed for the file download operation.


<?php
// File form server
$local_file = 'user.php';

// filename that the user gets as default
$download_file = 'myFile.php';

// set the download rate limit (=> 10 kb/s)
$download_rate = 10;

if(file_exists($local_file) && is_file($local_file)) {

    // send headers
    header('Cache-control: private');
    header('Content-Type: application/octet-stream');
    header('Content-Length: '.filesize($local_file));
    header('Content-Disposition: filename='.$download_file);

    // flush content
    flush();

    // open file stream
    $file = fopen($local_file, "r");

    while (!feof($file)) {

        // send the current file part to the browser
        print fread($file, round($download_rate * 10));

        // flush the content to the browser
        flush();

        // sleep one second
        sleep(1);
    }

    // close file stream
    fclose($file);
}
else {
    die('Error: The file '.$local_file.' does not exist!');
}
?>

For more:

Unknown Features
Beautiful Designs
Security Features

Google Stacked column charts

You can create a stacked column chart by setting isStacked option true in the normal column chart code. 
Here we are explaining the simple example.

Html Code

<html>
  <head>
    <script type="text/javascript" src="https://www.gstatic.com/charts/loader.js"></script>
    <script type="text/javascript">
      google.charts.load('current', {'packages':['bar']});
      google.charts.setOnLoadCallback(drawChart);

      function drawChart() {
        var data = google.visualization.arrayToDataTable([
          ['Year', 'Sales', 'Expenses', 'Profit'],
          ['2014', 1000, 400, 200],
          ['2015', 1170, 460, 250],
          ['2016', 660, 1120, 300],
        ]);

        var options = {
          chart: {
            title: 'Company Performance',
            subtitle: 'Sales, Expenses, and Profit: 2014-2017',
          },
          isStacked:true,
  colors:['orange'],
        };

        var chart = new google.charts.Bar(document.getElementById('columnchart_material'));

        chart.draw(data, google.charts.Bar.convertOptions(options));
      }
    </script>
  </head>
  <body>
    <div id="columnchart_material" style="width: 800px; height: 500px;"></div>
  </body>
</html>

Result

Google Pie Charts with PHP and MySQL

Populating pie charts with google api is one of the simplest way to do. here we are showing 
you a simple example to generate pie chart with real time data. fetching data from database table.
<?php
$DatabaseServer = "localhost";
$DatabaseUsername = "root";
$DatabasePassword = "root";
$DatabaseName = "demo";

$Connection = mysqli_connect($DatabaseServer, $DatabaseUsername, 
    $DatabasePassword, $DatabaseName);

if ($Connection === false) {
    die("ERROR: Could not connect. " . mysqli_connect_error());
}

$selectsql = "SELECT * FROM graph";
$result = mysqli_query($Connection, $selectsql);
?>

<html>
<head>
    <script type="text/javascript" 
            src="https://www.gstatic.com/charts/loader.js"></script>
    <script type="text/javascript">
        google.charts.load('current', {'packages':['corechart']});
        google.charts.setOnLoadCallback(drawChart);

        function drawChart() {

          var data = google.visualization.arrayToDataTable([
          ['Task', 'Hours per Day'],
          <?php while($row = mysqli_fetch_array($result)){  ?>
             ["<?php echo $row['name']; ?>", <?php echo $row['count']; ?>],
          <?php } ?>
          ]);

         var options = {
           title: 'My Daily Activities'
            };

         var chart = new google.visualization.PieChart
         (document.getElementById('piechart'));

         chart.draw(data, options);
        }
    </script>
</head>
<body>
<div id="piechart" style="width: 900px; height: 500px;"></div>
</body>
</html>
Run these queries in your database.
//Table structure for table `graph`
CREATE TABLE `graph` (
  `id` int(2) NOT NULL,
  `name` varchar(34) NOT NULL,
  `count` int(12) NOT NULL
) ENGINE=InnoDB DEFAULT CHARSET=latin1;

//Dumping data for table `graph`

INSERT INTO `graph` (`id`, `name`, `count`) VALUES
(1, 'Work', 11),
(2, 'Eat', 2),
(4, 'Commute', 2),
(5, 'Watch TV', 2),
(6, 'Sleep', 7);
Result:

Everything about google pie chart

Its always a good idea to represent your data in a graphical way. here we are explaining how to use google graphs API.
<html>
  <head>
    <script type="text/javascript" src="https://www.gstatic.com/charts/loader.js"></script>
    <script type="text/javascript">
      google.charts.load('current', {'packages':['corechart']});
      google.charts.setOnLoadCallback(drawChart);

      function drawChart() {

        var data = google.visualization.arrayToDataTable([
          ['Task', 'Hours per Day'],
          ['Work',     11],
          ['Eat',      2],
          ['Commute',  2],
          ['Watch TV', 2],
          ['Sleep',    7]
        ]);

        var options = {
          title: 'My Daily Activities'
        };

        var chart = new google.visualization.PieChart(document.getElementById('piechart'));

        chart.draw(data, options);
      }
    </script>
  </head>
  <body>
    <div id="piechart" style="width: 900px; height: 500px;"></div>
  </body>
</html>

Add these lines in your options variable

1. For 3D model pie chart.
is3D: true,

2. Adding background to pie chart
backgroundColor: 'skyblue',

3. Change legend text color and size
legendTextStyle: { color: 'red', fontSize: 15},

4. Change legend position
you can four different position options-top/bottom/left/right
legend:{ position:'bottom'},

5. Change title text color and size
titleTextStyle: { color: 'red', fontSize:16},

6. Change colors of pie slices
 colors: ['#e0440e', '#e6693e', '#ec8f6e', '#f3b49f', '#f6c7b6'],

7. Pie slice text display value and percentage
only for value.
 pieSliceText: 'value',

only for percentage
 pieSliceText: 'percentage',

for value and percentage
 pieSliceText: 'value-and-percentage',

8.Change pie slice(labels) text color and size
pieSliceTextStyle : {fontSize:16, color:'red'},
Result:


Drag the box using JQuery

<html>

<head>

<script src="https://code.jquery.com/jquery-1.12.4.js"></script>

<script src="https://code.jquery.com/ui/1.12.1/jquery-ui.js"></script>

<link rel="stylesheet"href="https://maxcdn.bootstrapcdn.com/bootstrap/4.0.0/ css/bootstrap.min.css">


<style type="text/css">

        #draggable { 

width: 100px; 

height: 60px; 

padding: 0.5em;

border: 1px solid;

background-color: orange;

}

        .box{

            width: 50%;

            height: auto;

            border: 1px solid black;

            padding: 10px;

            margin-bottom: 10px;

        }

body{

   padding:20px;

}

</style>

    <script>

        $(function() {

            var thHeight = $("table#demo-table th:first").height();

            $("table#demo-table th").resizable({

                handles: "e",

                minHeight: thHeight,

                maxHeight: thHeight,

                minWidth: 40,

                resize: function (event, ui) {

                    var sizerID = "#" + $(event.target).attr("id") + "-sizer";

                    $(sizerID).width(ui.size.width);

                }

            });

        });


        $( function() {

            $( "#draggable" ).draggable({ axis: "x" });


            $( "#draggable" ).draggable({ containment: "parent" });

        } );

    </script>


</head>

<body>

<div class="box">

<div id="draggable" class="ui-widget-content">

    <span>Draggable Box</span>

</div>

</div>

</body>

</html>

Output:


Resizeable table using javascript and jquery

<html>
<head>
<link rel="stylesheet" href="//code.jquery.com/ui/1.12.1/themes/base/jquery-ui.css">
<script src="https://code.jquery.com/jquery-1.12.4.js"></script>
<script src="https://code.jquery.com/ui/1.12.1/jquery-ui.js"></script>
<link rel="stylesheet" href="https://maxcdn.bootstrapcdn.com/bootstrap/3.3.7/css/bootstrap.min.css"
integrity="sha384-BVYiiSIFeK1dGmJRAkycuHAHRg32OmUcww7on3RYdg4Va+PmSTsz/K68vbdEjh4u"
crossorigin="anonymous">
<style type="text/css">
 body {
  font-family: Arial;
  font-size: 10pt;
  padding:20px;
 }
table#demo-table th {
  background-color: red;
  color: #fff;
  }
  table#demo-table th,
  table#demo-table td {
    white-space: nowrap;
    padding: 13px 10px;
   }
  table.cellpadding-0 td {
  padding: 0;
 }
 table.cellspacing-0 {
  border-spacing: 0;
  border-collapse: collapse;
 }
table.bordered th,
table.bordered td {
border: 1px solid #ccc;
border-right: none;
text-align: center;
  }
table.bordered th:last,
table.bordered td:last {
border-right: 1px solid #ccc;
 }
</style>
<script>
$(function() {
var thHeight = $("table#demo-table th:first").height();
$("table#demo-table th").resizable({
    handles: "e",
    minHeight: thHeight,
    maxHeight: thHeight,
    minWidth: 40,
    resize: function (event, ui) {
    var sizerID = "#" + $(event.target).attr("id") + "-sizer";
    $(sizerID).width(ui.size.width);
                }
   });
});
</script>
</head>
<body>
<table id="demo-table" class="bordered cellpadding-0 cellspacing-0">
    <thead>
    <tr>
        <th id='column-header-1'>S.No<div id='column-header-1-sizer'></div></th>
        <th id='column-header-2'>Subject<div id='column-header-2-sizer'></div></th>
        <th id='column-header-3'>Total Marks<div id='column-header-3-sizer'></div></th>
        <th id='column-header-4'>Gain<div id='column-header-4-sizer'></div></th>
        <th id='column-header-5'>Rank<div id='column-header-5-sizer'></div></th>
</tr>
    </thead>
    <tbody>
    <td>0001</td>
    <td>English</td>
    <td>100</td>
    <td>79</td>
    <td>13</td>
</tbody>
</table>

</body>

</html>
Result:


Simple User Registration Form Using PHP, MySQL

In this tutorial, I am illustrating a simple user registration form. register form is a common need in any kind of web-based application so here is register form using PHP, MySQL, HTML, and CSS.

<html>

<head>
    <link rel="stylesheet" href="https://maxcdn.bootstrapcdn.com/bootstrap/4.0.0/css/bootstrap.min.css">
    <style>
        body{
            padding:40px;
        }
        .container-one{
            width:340px;
            height:320px;
            border:1px solid black;
            padding-left:60px;
        }
        .btn {
            margin: 5px;
        }
    </style>
</head>

<body>

<h3>Register:</h3>

<div class="container-one">
    <form method="POST">
        <div class="col-md-5">
            First Name <input type="text" name="FirstName">
        </div>
        <div class="col-md-5">
            Last Name <input type="text" name="LastName">
        </div>
        <div class="col-md-2">
            Email <input type="text" name="Email">
        </div>
        <div class="col-md-3">
            Password <input type="password" name="Password">
        </div>
        <div class="col-md-2">
            City <input type="text" name="City">
        </div>
        <div class="col-md-2">
     <input type="submit" name="Submit" value="Submit" class="btn">
        </div>
    </form>
</div>

</body>
</html>
<?php
$DatabaseServer = "localhost";
$DatabaseUsername = "root";
$DatabasePassword = "root";
$DatabaseName = "demo";

$Connection = mysqli_connect($DatabaseServer,
 $DatabaseUsername, $DatabasePassword, $DatabaseName);
if ($Connection === false) {
    die("ERROR: Could not connect. " . mysqli_connect_error());
}
if (isset($_POST['Submit'])) {
    $FirstName = $_POST['FirstName'];
    $LastName = $_POST['LastName'];
    $Email = $_POST['Email'];
    $Password = $_POST['Password'];
    $City = $_POST['City'];
    $SQL = "INSERT INTO user 
(FirstName, LastName, Email, Password, City) 
VALUES ('$FirstName', '$LastName', '$Email', '$Password', '$City')";
    $result = mysqli_query($Connection, $SQL);
}
?>
Output:

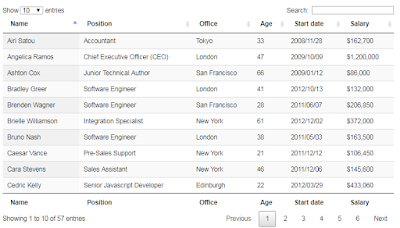
How to add filter, search and pagination options to your table using javascript & datatable?

Having pagination, search and filter options to your data table is very much essential. which changes the complete view of your table presentation.

Here is the simplest way of adding these three options to your table.
Add this block of code in your head section.
<link rel="stylesheet" 
href="https://cdn.datatables.net/1.10.16/css/jquery.dataTables.min.css">
<script type="text/javascript" 
src="https://code.jquery.com/jquery-1.12.4.js"></script>
<script type="text/javascript" 
src="https://cdn.datatables.net/1.10.16/js/jquery.dataTables.min.js">
</script>
<script>
    $(document).ready(function() {
        $('#example').DataTable();
    } );
</script>
Then add id and class to your table tag
<table id="example" class="display">
    <thead>
    <tr>
        <th>Name</th>
    </tr>
    </thead>
    <tbody>
    <tr>
        <td>Tiger Nixon</td>
    </tr>
    </tbody>
</table>
That's it your are done with the most usefull feature for tables.
Result:

Reference & For more vistit the link of official datable organization
https://datatables.net/examples/basic_init/zero_configuration.html

Encode and decode string with Base64 using PHP

base64_encode — Encodes data with MIME base64
string base64_encode ( $string )
This encoding is designed to make binary data survive transport through transport layers that are not 8-bit clean, such as mail bodies.
Base64-encoded data takes about 33% more space than the original data.

Base64_encode:
<?php
$plainText = 'http://www.phpjavascript.com/';
$base64 = base64_encode($plainText);
$base64url = strtr($base64, '+/=', '-_,');
echo $base64url;
?>
Result:
aHR0cDovL3d3dy5waHBqYXZhc2NyaXB0LmNvbS8,

Base64_decode:
<?php
$plainText = "aHR0cDovL3d3dy5waHBqYXZhc2NyaXB0LmNvbS8,";
$base64url = strtr($plainText, '-_,', '+/=');
$base64 = base64_decode($base64url);
echo $base64;
?>
Result:
http://www.phpjavascript.com/

Labels

php (35) javascript (31) phpjavascript (30) jquery (23) html (20) mysql (14) database (9) codeigniter (4) json (4) bar chart (2) calendar (2) column chart (2) framework (2) google maps (2) query (2) tables (2) url (2) dropdown (1)

Popular Posts